
In the world of personal finance, “cash is king” is a mantra that has echoed through boardrooms and household kitchens for decades. On the surface, it makes sense. Cash is tangible, liquid, and seemingly stable. However, as we navigate the economic complexities of 2026, many investors are beginning to realize that the face value of a dollar and the real value of cash are two very different things.
To build true wealth, one must look past the digits in a bank app and understand the underlying mechanics of purchasing power. If you have $10,000 in a safe today, you will still have $10,000 a year from now—but what that money can actually buy will have changed. This guide explores why understanding the real value of cash is the most important skill an investor can develop.
Table of Contents
The Illusion of Nominal Stability
The primary reason people hoard currency is the feeling of safety. Nominal value—the number printed on the bill—never changes. This creates a psychological “safety net.” However, this safety is often an illusion because it ignores the real value of cash over time.
When we talk about the real value of cash, we are referring to its purchasing power after adjusting for inflation. If the cost of goods and services rises by 4% in a year, and your cash sits in a non-interest-bearing account, the real value of cash in your possession has effectively dropped by 4%. You haven’t “lost” money in a literal sense, but you have lost the ability to acquire the same amount of value.
The Silent Thief: How Inflation Erodes the Real Value of Cash
Inflation is often described as a “silent tax.” It doesn’t appear as a line item on your paycheck, yet it eats away at your wealth every single day. To calculate the real value of cash, economists use the Fisher Equation:
r ≈ i − π
Where:
- r is the real interest rate (Real Value of Cash growth)
- i is the nominal interest rate
- π is the inflation rate
If your high-yield savings account offers a 4% return, but inflation is running at 5%, the real value of cash you are holding is actually shrinking by 1% annually. This is the paradox of “safe” investing: by avoiding market volatility, you are guaranteeing a slow, steady loss of purchasing power.
Historical Context: The 2020s Shift
Looking back at the early 2020s, we saw a period of hyper-awareness regarding the real value of cash. As global supply chains tightened and stimulus measures increased the money supply, inflation spiked. Those who held onto large sums of “safe” money saw the real value of cash plummet, while those invested in assets like real estate or equities saw their wealth grow in tandem with rising prices.
Opportunity Cost: The Hidden Price Tag
Beyond inflation, we must consider opportunity cost. This is the loss of potential gain from other alternatives when one alternative is chosen. When you prioritize the nominal “safety” of a bank account, the real value of cash is hampered by what that money could have been doing elsewhere.
For example, if the stock market returns an average of 8% per year and you choose to keep $50,000 in a checking account for five years, the “cost” of that decision isn’t just the 3-4% lost to inflation. It is the massive gap between your stagnant balance and the compounded growth of a diversified portfolio. In this context, the real value of cash is not just about what it buys today, but about the future wealth it fails to generate.
When Cash is Actually King: The Liquidity Premium
Is the real value of cash always declining? Not necessarily. There are specific market conditions where holding liquid assets is the smartest move you can make. This is known as the “liquidity premium.”
- Market Volatility: During a market crash, the real value of cash increases in terms of “buying power” relative to stocks. If the S&P 500 drops 20%, your cash can now buy 20% more shares than it could a month ago.
- Emergency Funds: The real value of cash in an emergency fund is measured in peace of mind. While it may lose 3% to inflation, it saves you from high-interest credit card debt (often 20%+) if your car breaks down.
- Deflationary Periods: In the rare event of deflation, the real value of cash actually increases. As prices drop, each dollar buys more.
Strategizing the Real Value of Cash in 2026
To manage your finances professionally, you need a tiered approach to liquidity. You shouldn’t ignore the real value of cash, but you shouldn’t be terrified of it either.
The Three-Tier Liquidity Model
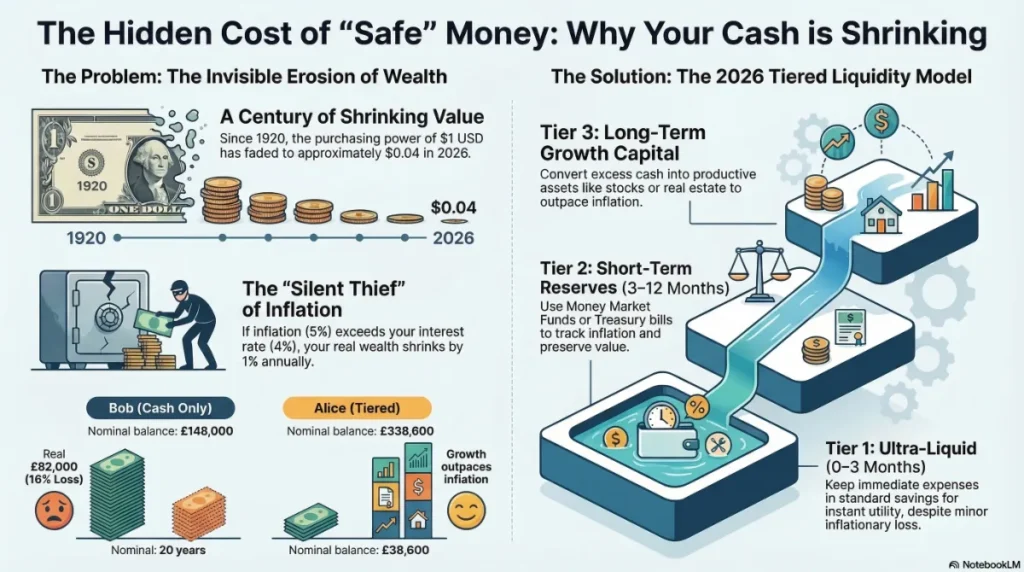
- Tier 1: Ultra-Liquid (0-3 Months of Expenses)Keep this in a standard savings account. Yes, the real value of cash here will decrease slightly over time, but the “utility value” of having instant access to funds outweighs the inflationary loss.
- Tier 2: Short-Term Reserves (3-12 Months of Expenses)Use Money Market Funds or short-term Treasury bills. These instruments are designed to track closer to inflation, helping to preserve the real value of cash without taking on significant market risk.
- Tier 3: Long-Term CapitalThis money should almost never stay in cash. To protect the real value of cash over decades, it must be converted into “productive assets”—stocks, bonds, or real estate—that have the potential to outpace inflation.
The Psychological Trap of Nominal Loss Aversion
Most humans suffer from “loss aversion.” We feel the pain of losing $100 twice as much as the joy of gaining $100. This is why many struggle to grasp the real value of cash. Seeing a $0.00 change in a bank balance feels better than seeing a $500 drop in a brokerage account, even if inflation made that “stable” bank balance worth $600 less in actual purchasing power.
To become a sophisticated investor, you must train your brain to see the real value of cash rather than the nominal number. When you look at your bank statement, mentally subtract the current inflation rate. If that number bothers you, it’s a sign that your allocation of liquid assets is too high.
Conclusion: Balancing Security and Growth
The real value of cash is a moving target. It is influenced by central bank policies, global trade, and consumer sentiment. While cash provides a necessary cushion for life’s unpredictability, holding too much of it is a surefire way to see your long-term wealth erode.
In 2026, the goal isn’t to avoid cash entirely, but to be intentional about it. Understand that every dollar you keep liquid has a “burn rate” dictated by the economy. By balancing your need for immediate liquidity with a strategy that protects the real value of cash through smart investments, you can ensure that your hard-earned money works as hard for you as you did for it.
The real value of cash is ultimately found in its utility. Use it for what it’s best for—short-term stability—and use the market for what it’s best for—long-term growth.
The Math of “Cash Drag”
To understand the full impact of holding too much liquidity, we must examine the concept of Cash Drag. This is the negative effect that a large allocation of low-yielding cash has on the overall performance of an investment portfolio.
The math of cash drag is subtle but devastating over time. It represents the gap between what your total portfolio could return if fully invested versus what it actually returns because a portion is sitting idle.
The Compound Interest Problem
The issue isn’t just that the real value of cash in that specific account is shrinking; it’s that those dollars are not participating in the greatest force in finance: compounding.
Compounding works exponentially. It’s not just interest on your principal; it’s interest on your interest. By keeping money in a vehicle where the real value of cash is negative (meaning the return is lower than inflation), you aren’t just losing a linear amount of money each year—you are dramatically shrinking the future base of capital that can compound.
A Scenario: $100,000 Over 20 Years
Let’s assume inflation averages 3% annually over the next two decades. We have two investors, Alice and Bob, each with $100,000.
- Bob (The “Safe” Investor): Fearing volatility, Bob keeps all $100,000 in a savings account that averages a 2% nominal return. After 20 years, his nominal balance is approximately $148,000. He feels successful. However, the real value of cash in his account has fallen significantly. Because inflation was 3%, that $148,000 can only purchase what $82,000 could buy 20 years ago. Bob actually lost 18% of his purchasing power.
- Alice (The Strategic Investor): Alice uses a tiered approach. She keeps $20,000 (representing her safety net) in the same 2% savings account but invests the remaining $80,000 in a diversified portfolio averaging a 7% nominal return.
After 20 years, Alice’s $20,000 cash portion has grown to $29,600 (suffering the same loss in real value as Bob’s). But her $80,000 investment has compounded to approximately $309,000.
- Alice’s Total Nominal Wealth: $338,600
- Bob’s Total Nominal Wealth: $148,000
The real value of cash that Bob prioritized actually cost him nearly $200,000 in potential wealth compared to Alice. Alice understood that while the real value of cash in her safety net was decreasing, the utility value of that safety net enabled her to keep the rest of her capital working in productive assets that outpaced inflation.
This is where a visualization becomes essential. It helps the reader look past the $148,000 number Bob sees and understand the $82,000 reality.
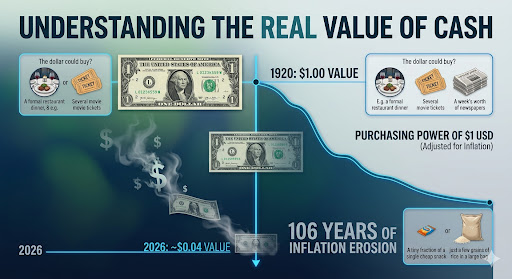
Visualizing the Erosion: $1 from 1920 to 2026
To truly respect the threat to the real value of cash, we must visualize it over a long enough horizon. A century of data provides an undeniable perspective. The image below will illustrate how the purchasing power of a single US dollar has transformed.
When you hold onto a significant amount of cash for decades, this is what is happening to the real value of cash in your possession. A dollar today may buy a coffee; a dollar in 1920 bought a meal. When you leave money “idle” to avoid risk, the visual below is the inevitable, mathematical risk you are choosing instead.
Here is the detailed image prompt to generate this visualization for your blog.
Visualizing the Erosion: $1 from 1920 to 2026
To truly respect the threat to the real value of cash, we must visualize it over a long enough horizon. A century of data provides an undeniable perspective. The image below illustrates how the purchasing power of a single US dollar has transformed.
When you hold onto a significant amount of cash for decades, this is what is happening to the real value of cash in your possession. A dollar today may buy a coffee; a dollar in 1920 bought a meal. When you leave money “idle” to avoid risk, the visual below is the inevitable, mathematical risk you are choosing instead.
This visualization has generated beautifully and is exactly what your readers need to see.
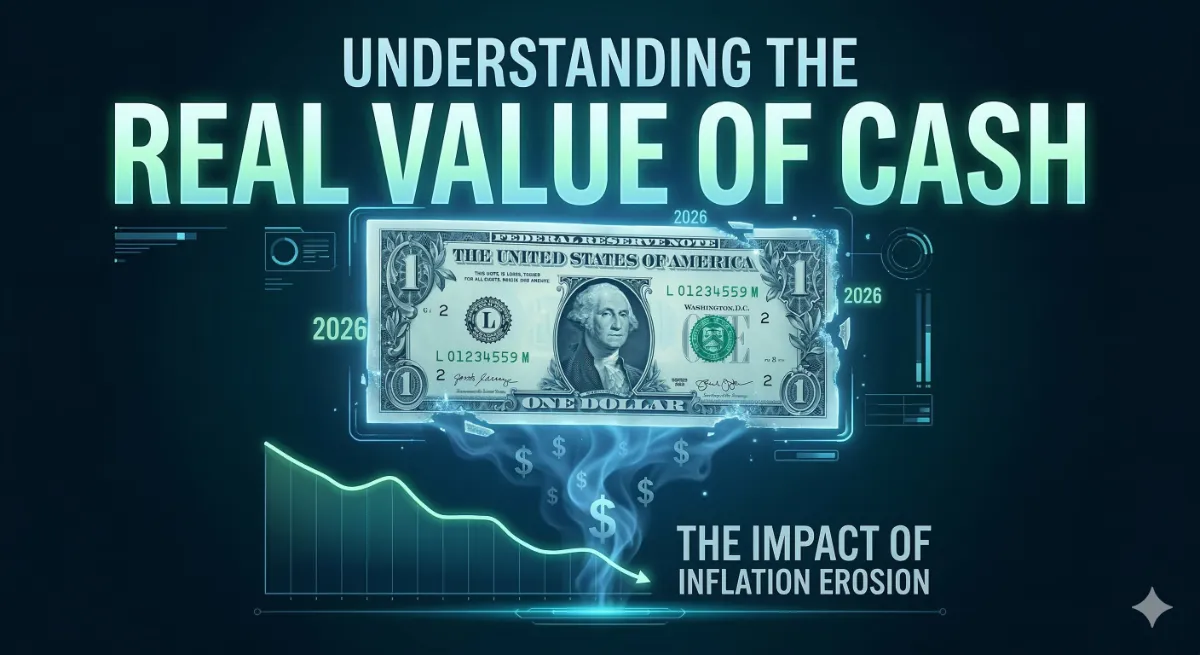
It captures the 106-year timeline, from the full-value dollar in 1920 (top) down to the severely eroded, ghostly value in 2026 (bottom). The key takeaways are highlighted clearly:
- The Title: “Understanding the Real Value of Cash” is prominent and instantly sets the educational tone.
- Visual Proof: The dynamic line graph shows a devastating and undeniable curve that makes the concept of inflation real.
- Actionable Data: The overlay specifically calls out that $1 USD has faded to just ~ $0.04 value over the last 106 years. The accompanying graphic of floating currency symbols dissolving into smoke perfectly visualizes the erosion of real value.
Is Your Money Truly Safe? An In-Depth Guide to Banking System Safety in India
Understanding Cash Flow Statements: A Step-by-Step Guide to Analysis and Interpretation